
Charts are context — not the whole thesis
Stock charting software helps you see trend, volatility, and liquidity. It does not tell you whether cash flows justify the price. The best setups in 2026 combine capable charts with a path into fundamental research.
This comparison focuses on equity charting for investors and active traders who also care about research quality.
Comparison table
| Platform | Chart UX | Indicators | Research nearby | Best for |
|---|---|---|---|---|
| Vest Terminal | Strong | Core set | Full terminal | Charts + research |
| TradingView | Excellent | Huge library | Limited | Pure charting |
| Thinkorswim | Excellent | Advanced | Brokerage | Active traders |
| TrendSpider | Strong | Automation | Limited | Pattern automation |
| Yahoo Finance | Basic | Basic | News/quotes | Casual charts |
| Bloomberg | Excellent | Institutional | Full terminal | Desks |
| Koyfin | Strong | Solid | Dashboards | Advisor visuals |
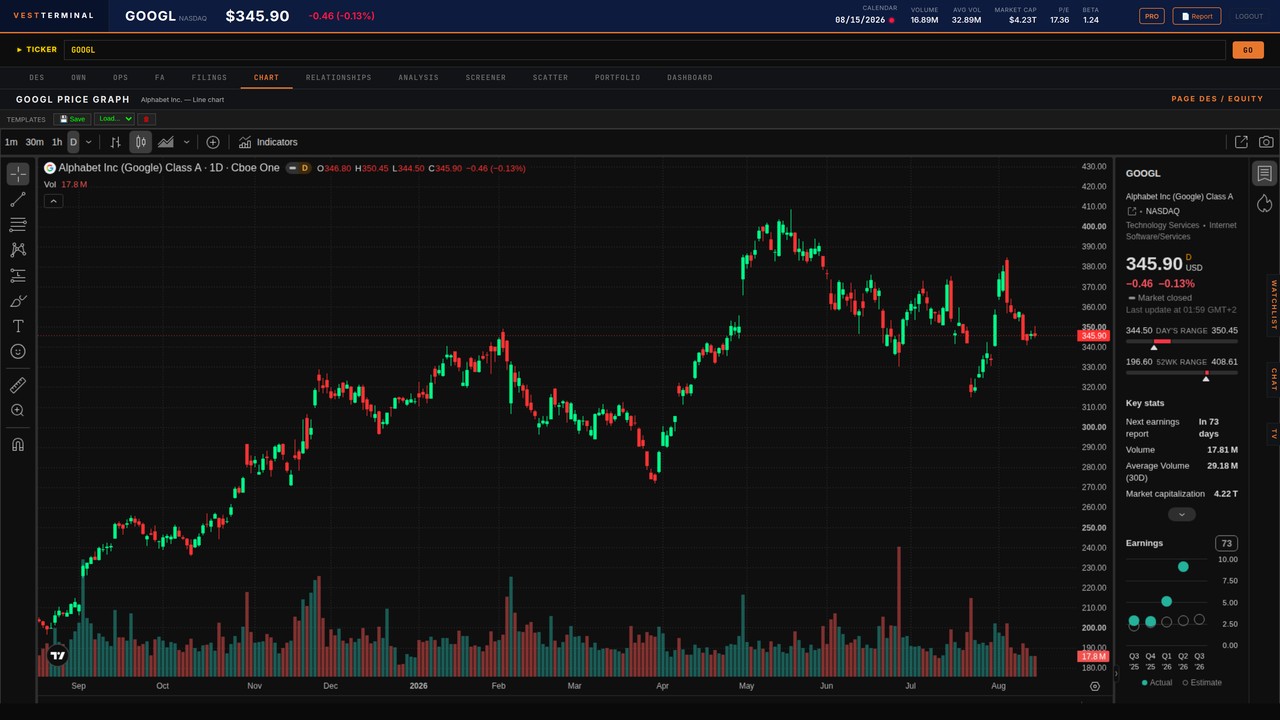
Open a ticker chart inside Vest Terminal.
Start Free1. Vest Terminal charts
Vest’s chart module sits beside DES, FA, filings, and portfolio tools. That adjacency reduces the classic failure mode: beautiful charts detached from business reality.
Use charts to time entries and understand volatility regimes; use financial analysis guides and FA views to justify ownership.
2. TradingView
The benchmark for drawings, scripts, and community ideas. Ideal as a specialist charting layer.
3. Thinkorswim
Powerful for active traders who want broker-native analytics. Heavier than a web research terminal for casual investors.
4–7. TrendSpider, Yahoo, Bloomberg, Koyfin
TrendSpider automates pattern detection. Yahoo covers basics. Bloomberg remains institutional-grade. Koyfin emphasizes dashboard storytelling. Pick based on whether automation, free access, desk tools, or client visuals are the bottleneck.
A simple chart checklist before you buy
- Identify trend on weekly and daily timeframes
- Check volume confirmation on breakouts
- Note distance from 52-week highs/lows
- Only then open fundamentals and filings
Combine charts with fundamentals in Vest Terminal.
Start FreeAdvanced angles on 7 Best Stock Charting Software Options in 2026
As you go deeper on 7 best stock charting software options in 2026, distinguish leading indicators from lagging confirmations. Leading indicators help you prepare; lagging confirmations help you avoid self-deception after the fact.
Create a one-page scorecard unique to this topic with no more than eight fields. If a field never changes a decision, delete it. Scorecards exist to force trade-offs, not to decorate research folders.
Share the scorecard with a skeptical peer or future-you note. The act of explaining 7 best stock charting software options in 2026 out loud usually reveals hidden assumptions faster than another hour of silent browsing.
Translate qualitative claims into observable metrics whenever possible. “Strong moat” should map to retention, margins, or reinvestment returns; “cheap” should map to a multiple versus history and peers.
Build a small library of prior examples — both successes and failures — tagged by the failure mode. Pattern recognition across your own history is more valuable than collecting more unused frameworks.
Deeper implementation notes
After you understand the core framework, implementation quality determines outcomes. Write down the exact data sources you trust, the cadence of reviews, and the personal rules that prevent impulsive overrides when headlines spike.
Keep a short research journal for every active idea: date opened, thesis in three bullets, key metrics to watch, valuation paid, and the conditions that would force an exit or a trim. Journals turn vague conviction into auditable process.
When metrics conflict, prioritize cash generation and balance-sheet resilience over elegant narratives. Markets eventually reconcile stories with free cash flow, funding needs, and competitive reality.
Connecting research to portfolio construction
A researched idea still needs sizing. Cap single-name risk, consider correlation with what you already own, and avoid letting a high-conviction story become an accidental concentrated bet.
Use watchlists as a staging area. Not every researched ticker deserves capital today. Staging reduces FOMO buys and creates a ready pipeline when prices or setups improve.
Revisit winners and losers with the same checklist. Process reviews beat outcome celebrations — a profitable mistake can still teach the wrong lesson if you never inspect how the decision was made.
Using Vest Terminal without drowning in tabs
A practical session structure helps: screen or watchlist first, DES for business orientation, FA for multi-year numbers, filings for surprises, ownership for incentive context, then chart for timing. Close with a written decision.
Link education as you go. If a multiple or margin confuses you, open the matching Learn guide, then return to the live ticker. Definitions that stay consistent across notes make historical comparisons meaningful.
On paid plans, saved screens, broader limits, and collaboration features reduce friction for teams. Start with the free workflow until the bottleneck is clearly product limits rather than personal process gaps.
Risk, uncertainty, and intellectual honesty
Every framework fails in some regimes. Name those regimes in advance. If your approach assumes stable margins, ask what industry shock would break them. If it assumes mean reversion, ask what structural change would prevent it.
Prefer base rates and peer evidence over single anecdotes. One spectacular success story is marketing; a distribution of outcomes across similar businesses is research.
Finally, separate forecasting from positioning. You can be uncertain about precise outcomes and still take a modest, well-risked position when asymmetric payoff and process quality line up.
Action plan for the next seven days
Day 1–2: pick one workflow from this article and run it on two familiar large caps. Day 3–4: document what felt unclear and fill those gaps with Learn guides. Day 5: build or refine one screener or watchlist rule set. Day 6–7: review notes and delete steps you did not actually use.
Compression beats collection. A shorter checklist you execute weekly outperforms a perfect checklist you abandon. Revisit this article monthly until the steps are muscle memory.
When you are ready to operationalize, keep Vest Terminal open beside your notes so evidence gathering and decision writing happen in one sitting rather than across a week of forgotten tabs.
Advanced angles on 7 Best Stock Charting Software Options in 2026
As you go deeper on 7 best stock charting software options in 2026, distinguish leading indicators from lagging confirmations. Leading indicators help you prepare; lagging confirmations help you avoid self-deception after the fact.
Create a one-page scorecard unique to this topic with no more than eight fields. If a field never changes a decision, delete it. Scorecards exist to force trade-offs, not to decorate research folders.
Share the scorecard with a skeptical peer or future-you note. The act of explaining 7 best stock charting software options in 2026 out loud usually reveals hidden assumptions faster than another hour of silent browsing.
Translate qualitative claims into observable metrics whenever possible. “Strong moat” should map to retention, margins, or reinvestment returns; “cheap” should map to a multiple versus history and peers.
Build a small library of prior examples — both successes and failures — tagged by the failure mode. Pattern recognition across your own history is more valuable than collecting more unused frameworks.
Deeper implementation notes
After you understand the core framework, implementation quality determines outcomes. Write down the exact data sources you trust, the cadence of reviews, and the personal rules that prevent impulsive overrides when headlines spike.
Keep a short research journal for every active idea: date opened, thesis in three bullets, key metrics to watch, valuation paid, and the conditions that would force an exit or a trim. Journals turn vague conviction into auditable process.
When metrics conflict, prioritize cash generation and balance-sheet resilience over elegant narratives. Markets eventually reconcile stories with free cash flow, funding needs, and competitive reality.
Connecting research to portfolio construction
A researched idea still needs sizing. Cap single-name risk, consider correlation with what you already own, and avoid letting a high-conviction story become an accidental concentrated bet.
Use watchlists as a staging area. Not every researched ticker deserves capital today. Staging reduces FOMO buys and creates a ready pipeline when prices or setups improve.
Revisit winners and losers with the same checklist. Process reviews beat outcome celebrations — a profitable mistake can still teach the wrong lesson if you never inspect how the decision was made.
Using Vest Terminal without drowning in tabs
A practical session structure helps: screen or watchlist first, DES for business orientation, FA for multi-year numbers, filings for surprises, ownership for incentive context, then chart for timing. Close with a written decision.
Link education as you go. If a multiple or margin confuses you, open the matching Learn guide, then return to the live ticker. Definitions that stay consistent across notes make historical comparisons meaningful.
On paid plans, saved screens, broader limits, and collaboration features reduce friction for teams. Start with the free workflow until the bottleneck is clearly product limits rather than personal process gaps.
Risk, uncertainty, and intellectual honesty
Every framework fails in some regimes. Name those regimes in advance. If your approach assumes stable margins, ask what industry shock would break them. If it assumes mean reversion, ask what structural change would prevent it.
Prefer base rates and peer evidence over single anecdotes. One spectacular success story is marketing; a distribution of outcomes across similar businesses is research.
Finally, separate forecasting from positioning. You can be uncertain about precise outcomes and still take a modest, well-risked position when asymmetric payoff and process quality line up.
Action plan for the next seven days
Day 1–2: pick one workflow from this article and run it on two familiar large caps. Day 3–4: document what felt unclear and fill those gaps with Learn guides. Day 5: build or refine one screener or watchlist rule set. Day 6–7: review notes and delete steps you did not actually use.
Compression beats collection. A shorter checklist you execute weekly outperforms a perfect checklist you abandon. Revisit this article monthly until the steps are muscle memory.
When you are ready to operationalize, keep Vest Terminal open beside your notes so evidence gathering and decision writing happen in one sitting rather than across a week of forgotten tabs.
Advanced angles on 7 Best Stock Charting Software Options in 2026
As you go deeper on 7 best stock charting software options in 2026, distinguish leading indicators from lagging confirmations. Leading indicators help you prepare; lagging confirmations help you avoid self-deception after the fact.
Create a one-page scorecard unique to this topic with no more than eight fields. If a field never changes a decision, delete it. Scorecards exist to force trade-offs, not to decorate research folders.
Share the scorecard with a skeptical peer or future-you note. The act of explaining 7 best stock charting software options in 2026 out loud usually reveals hidden assumptions faster than another hour of silent browsing.
Translate qualitative claims into observable metrics whenever possible. “Strong moat” should map to retention, margins, or reinvestment returns; “cheap” should map to a multiple versus history and peers.
Build a small library of prior examples — both successes and failures — tagged by the failure mode. Pattern recognition across your own history is more valuable than collecting more unused frameworks.
Deeper implementation notes
After you understand the core framework, implementation quality determines outcomes. Write down the exact data sources you trust, the cadence of reviews, and the personal rules that prevent impulsive overrides when headlines spike.
Keep a short research journal for every active idea: date opened, thesis in three bullets, key metrics to watch, valuation paid, and the conditions that would force an exit or a trim. Journals turn vague conviction into auditable process.
When metrics conflict, prioritize cash generation and balance-sheet resilience over elegant narratives. Markets eventually reconcile stories with free cash flow, funding needs, and competitive reality.
Connecting research to portfolio construction
A researched idea still needs sizing. Cap single-name risk, consider correlation with what you already own, and avoid letting a high-conviction story become an accidental concentrated bet.
Use watchlists as a staging area. Not every researched ticker deserves capital today. Staging reduces FOMO buys and creates a ready pipeline when prices or setups improve.
Revisit winners and losers with the same checklist. Process reviews beat outcome celebrations — a profitable mistake can still teach the wrong lesson if you never inspect how the decision was made.
Using Vest Terminal without drowning in tabs
A practical session structure helps: screen or watchlist first, DES for business orientation, FA for multi-year numbers, filings for surprises, ownership for incentive context, then chart for timing. Close with a written decision.
Link education as you go. If a multiple or margin confuses you, open the matching Learn guide, then return to the live ticker. Definitions that stay consistent across notes make historical comparisons meaningful.
On paid plans, saved screens, broader limits, and collaboration features reduce friction for teams. Start with the free workflow until the bottleneck is clearly product limits rather than personal process gaps.
Risk, uncertainty, and intellectual honesty
Every framework fails in some regimes. Name those regimes in advance. If your approach assumes stable margins, ask what industry shock would break them. If it assumes mean reversion, ask what structural change would prevent it.
Prefer base rates and peer evidence over single anecdotes. One spectacular success story is marketing; a distribution of outcomes across similar businesses is research.
Finally, separate forecasting from positioning. You can be uncertain about precise outcomes and still take a modest, well-risked position when asymmetric payoff and process quality line up.
Action plan for the next seven days
Day 1–2: pick one workflow from this article and run it on two familiar large caps. Day 3–4: document what felt unclear and fill those gaps with Learn guides. Day 5: build or refine one screener or watchlist rule set. Day 6–7: review notes and delete steps you did not actually use.
Compression beats collection. A shorter checklist you execute weekly outperforms a perfect checklist you abandon. Revisit this article monthly until the steps are muscle memory.
When you are ready to operationalize, keep Vest Terminal open beside your notes so evidence gathering and decision writing happen in one sitting rather than across a week of forgotten tabs.